
Measurements
Speed, wow and flutter measurements of a Transrotor turntable
This site promised instrumented tests as soon as Isostase was running. Here are the first ones, on a single turntable: figures published with their method and their limits, not a datasheet.
Context
Isostase drives a Transrotor Zet 3, first with one motor, then with two. The table compares several Isostase configurations with two original Transrotor power supplies, anonymised (A and B): the aim is to give orders of magnitude, not to rank models. The original supplies were measured as found, with no adjustment. All measurements were made on the same turntable under the same conditions.
Method
- Record: The Ultimate Analogue Test LP, side 1, track 10 (a 3,150 Hz tone intended for wow and flutter).
- Acquisition: QuantAsylum QA403 interface, Python script, 40 seconds per run (about 22 platter revolutions). Four runs per configuration, averaged; they are very close to one another.
- Processing: the instantaneous frequency of the tone is converted into a relative deviation (%), analysed by FFT, weighted with an AES6-type curve, then split into two bands: wow from 0.5 to 6 Hz, flutter from 6 to 200 Hz. The RMS value of each band is taken; the total weighted W&F is the square root of the sum of their squares.
- Speed: derived from the same tone, relative to 33.333 rpm.
An important caveat: this is an AES6-type weighting with RMS detection. It is not a measurement conforming to AES6-2008, which defines a weighted peak detection, and the wow/flutter split at 6 Hz is a choice of our own processing. These values are therefore not directly comparable with a datasheet figure quoted "to AES6".
Results
| Configuration | Speed (rpm) | Deviation | Wow (%) | Flutter (%) | Weighted W&F (%) |
|---|---|---|---|---|---|
| Isostase, 2 motors, regulated, quiet listening 70% | 33.342 | +0.025 % | 0.0479 | 0.0175 | 0.0510 |
| Isostase, 2 motors, regulated, 100% | 33.338 | +0.013 % | 0.0474 | 0.0184 | 0.0508 |
| Isostase, 2 motors, unregulated, 100% | 33.339 | +0.016 % | 0.0471 | 0.0181 | 0.0505 |
| Isostase, 1 motor, unregulated, 100% | 33.495 | +0.48 % | 0.0412 | 0.0189 | 0.0453 |
| Isostase, 1 motor, regulated, 100% | 33.342 | +0.025 % | 0.0451 | 0.0194 | 0.0491 |
| Original supply A, 1 motor | 33.543 | +0.63 % | 0.0465 | 0.0187 | 0.0501 |
| Original supply B (cold), 1 motor | 33.822 | +1.47 % | 0.0462 | 0.0195 | 0.0501 |
| Original supply B (warm), 1 motor | 33.656 | +0.97 % | 0.0459 | 0.0194 | 0.0498 |
Deviation is the difference between the measured speed and 33.333 rpm. "70%" and "100%" refer to the Isostase output amplitude. In both rows for supply B the turntable is already at temperature: it is the supply's output frequency that changes with its own temperature. The deviation is positive when the platter runs too fast.
What these measurements show
- Speed. With regulation, speed stays within 0.013 to 0.025% of nominal. The original supplies, measured as found, are at +0.63% and +1.47% (+0.97% once warm). To the ear, 0.5% is about 8 cents and 1.5% about 25 cents, a quarter of a semitone. Fine adjustment of these supplies might have reduced the error: what is compared here is their as-found state. On Isostase, the fine frequency adjustment, set separately for each speed, makes it simple to bring this error back to zero, even in open loop. A fixed setting does not follow drift during use, however, such as the one seen on supply B with temperature: that is the job of the regulation.
- Wow and flutter. All weighted totals lie between 0.045 and 0.051%, with wow from 0.041 to 0.048% and flutter from 0.0175 to 0.0195%. Isostase does not measurably degrade wow and flutter compared with the original supplies. It does not improve them either: the differences between configurations are too small to interpret.
- Regulation. It corrects the average speed; it is not designed to reduce wow and flutter that originates mostly in the record, cartridge, arm or platter.
- Torque at 45 rpm. On our unit of original supply B, the output voltage is not enough to hold a constant torque at 45 rpm: the platter struggles to reach speed at every start. For Isostase, 18 V RMS is enough to drive the motor properly at 33⅓ rpm; 45 rpm needs 24 V RMS (same voltage-to-frequency ratio). The pre-series unit currently tops out at 19.5 V RMS at 45 rpm (measured on 150 Ω); the production version will deliver these 24 V RMS. These torque observations are qualitative, made on one unit of each supply; the 24 V RMS figure comes from the voltage-to-frequency ratio, not from a torque measurement.
Why 50 Hz does not give 33.333 rpm
The only real surprise in these measurements: at exactly 50 Hz, the turntable runs too fast.
With exactly 50 Hz, a synchronous motor would in theory give 33.333 rpm. On the production configuration, the measurement says otherwise: it takes about 49.8 Hz (multimeter) for the optical sensor to report 33.33 rpm and for the 1 kHz track of the test record to read 1.000 kHz. At exactly 50 Hz the platter would therefore run about 0.4% too fast (calculated: a synchronous motor's speed is proportional to frequency). This is not drift: it is a static mechanical ratio (pulley, belt, slip) specific to this turntable. A supply with an "exact" frequency therefore does not guarantee the right speed. Only measuring the actual platter speed does, which is what regulation does. The table (1 motor, unregulated), in open loop at 50 Hz, showed a deviation in the same direction and of the same order (+0.48%).
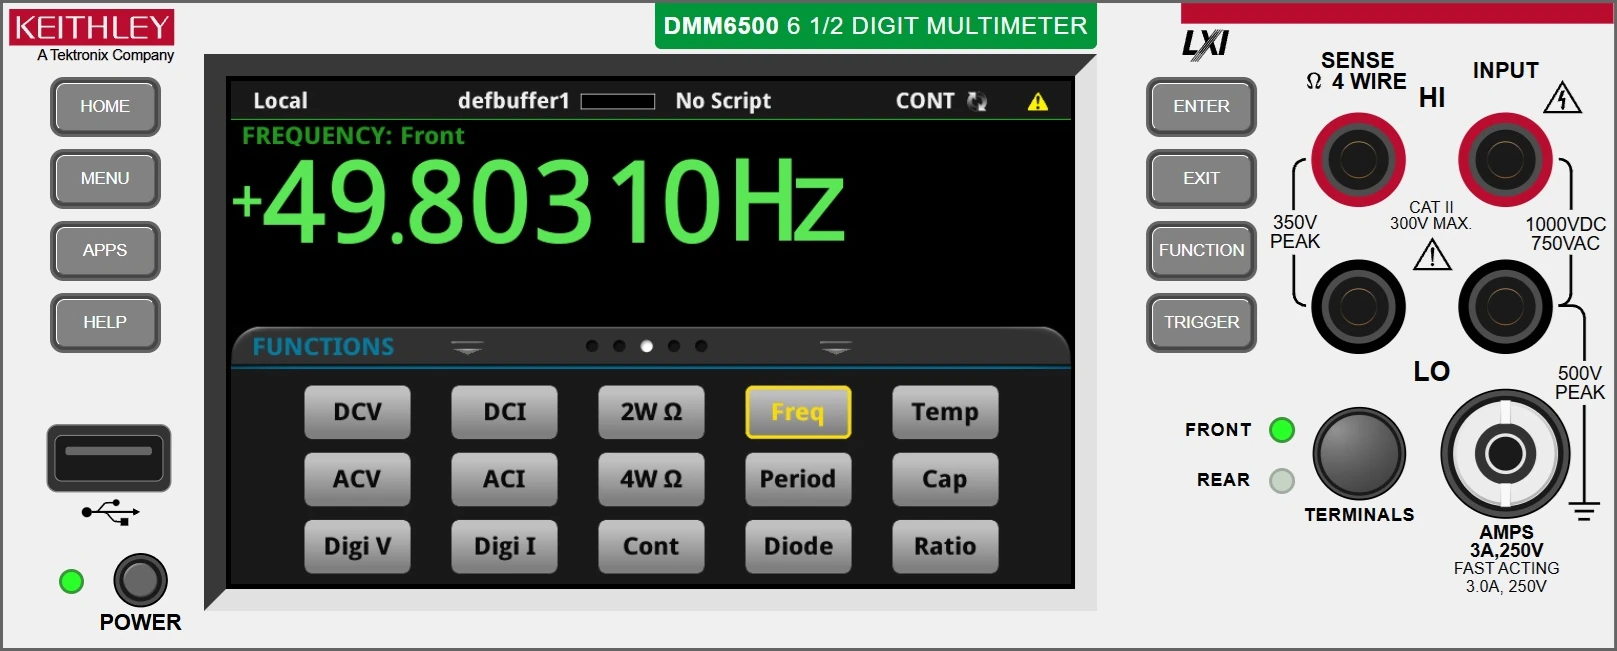
Multimeter accuracy at this frequency: ±0.030% of reading (≈ ±15 mHz); the last displayed digits are not significant.
Frequency reference: before and after calibration
Isostase's output frequency is derived from a crystal reference, calibrated at the factory on each unit. Below, for the production configuration, is the 1 kHz calibration frequency read with a Keithley DMM6500 multimeter, before and after calibration.
Both images are captures of the DMM6500's virtual front panel: the instrument's web interface (LXI) reproduces its front panel, display included. They are not photographs of the physical screen. Clicking an image opens it at full size.
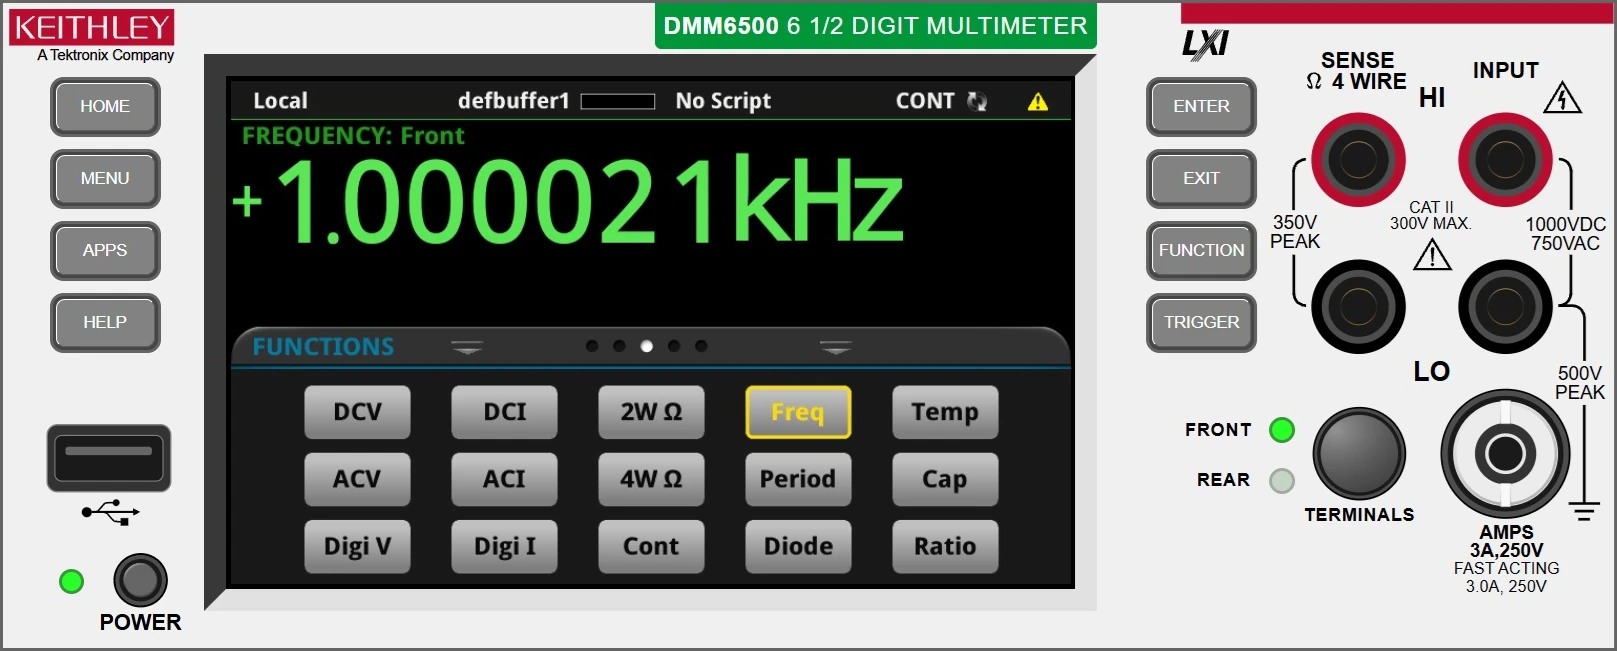
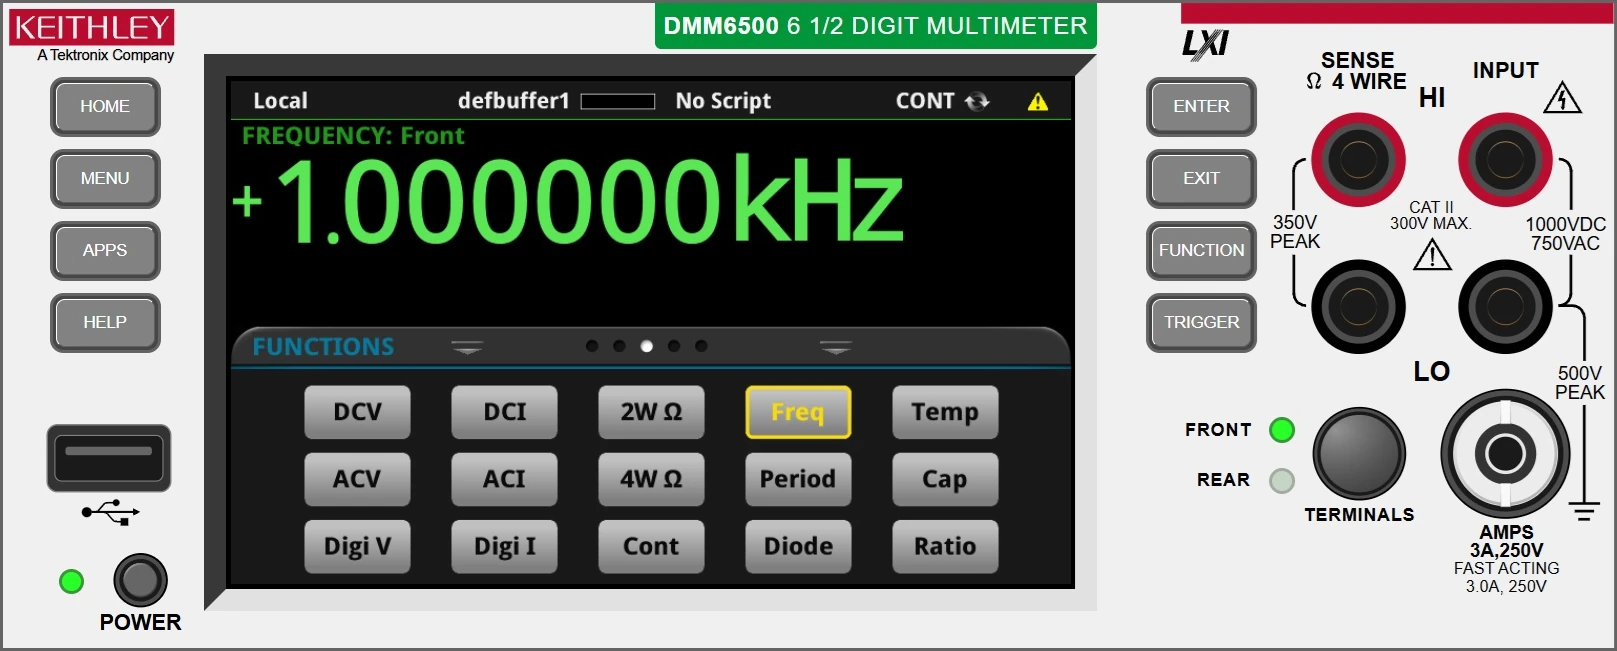
The multimeter displays frequency with a resolution of 1 mHz (1 ppm at 1 kHz). It is less than six months old and its datasheet gives an uncertainty of ±0.010 % of reading at 1 kHz, i.e. 100 ppm (2-year specification). The 21 ppm offset before calibration is therefore smaller than the instrument's absolute uncertainty: these two readings, taken with the same multimeter under the same conditions, show the shift in frequency, but on their own they do not demonstrate an absolute accuracy of 1 ppm.
Motor outputs on the oscilloscope
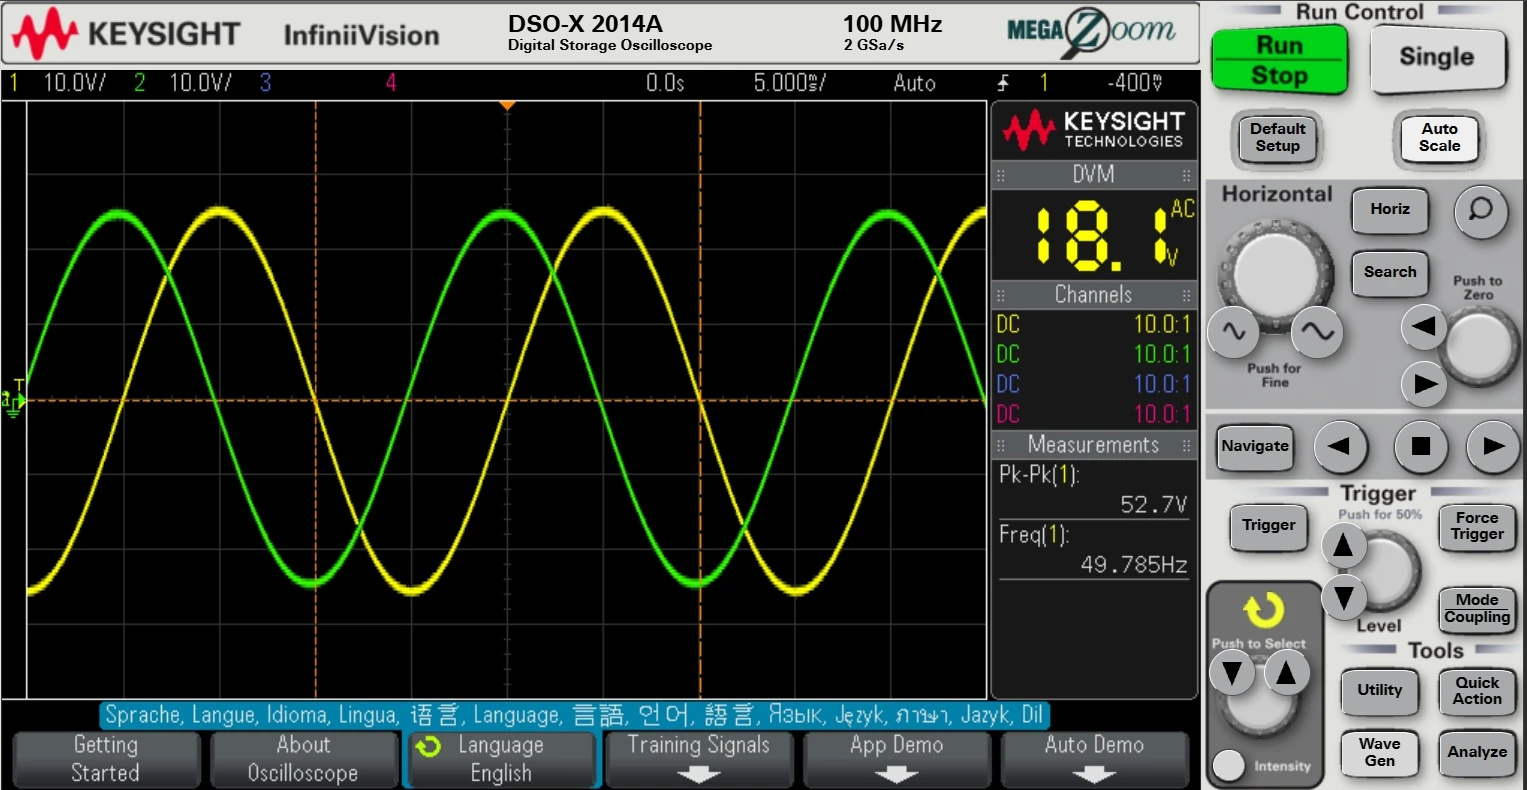
Same principle as for the frequency: these captures come from the virtual front panel of a Keysight DSO-X 2014A oscilloscope (100 MHz), displayed in a browser. For the production configuration, they show both phases of the motor output (channel 1 in yellow, channel 2 in green; 10 V/div, 5 ms/div) with the motor under load, at 100% and then at 70% (quiet listening). Clicking an image opens it at full size.
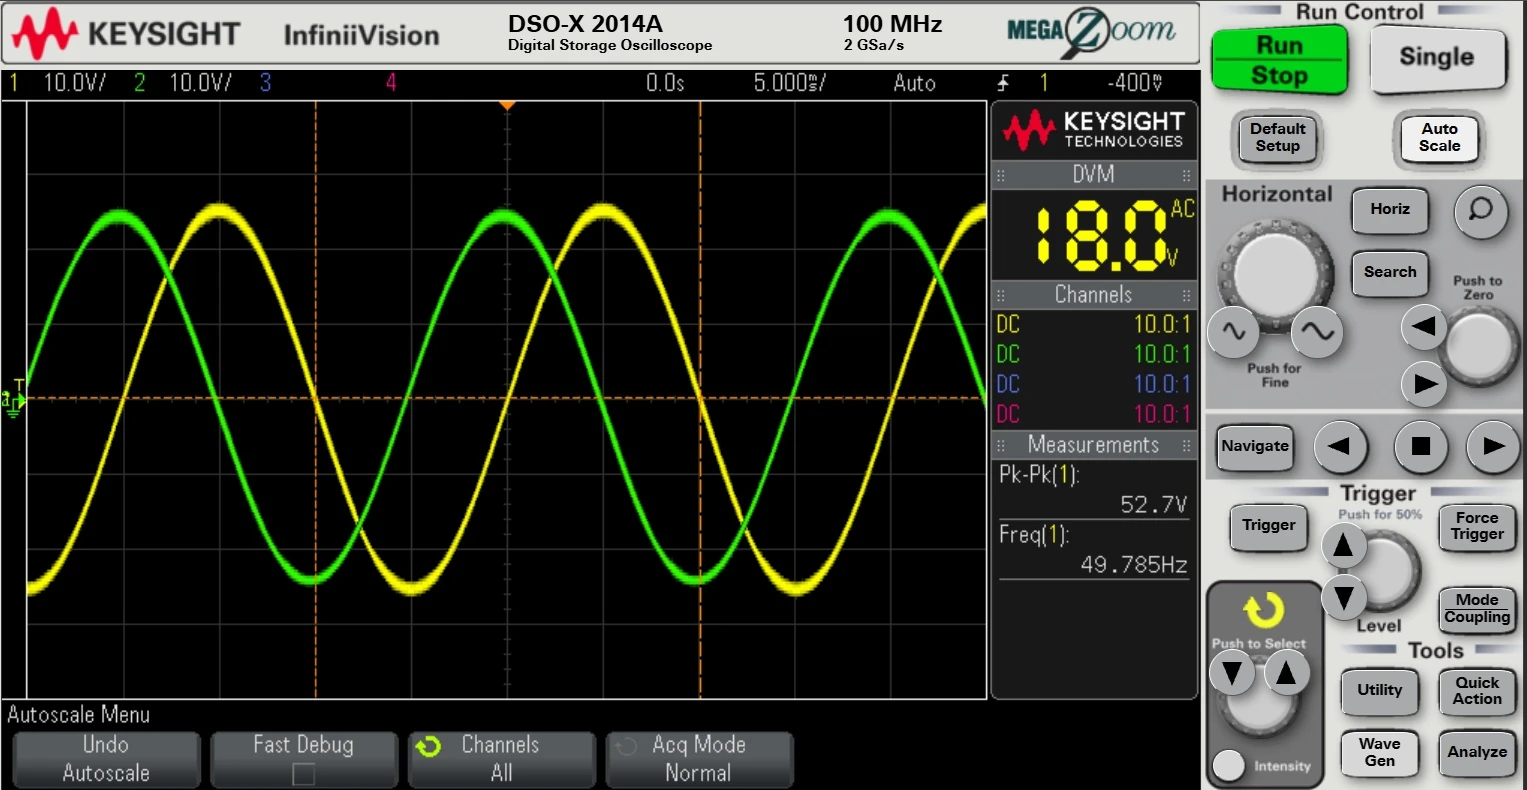
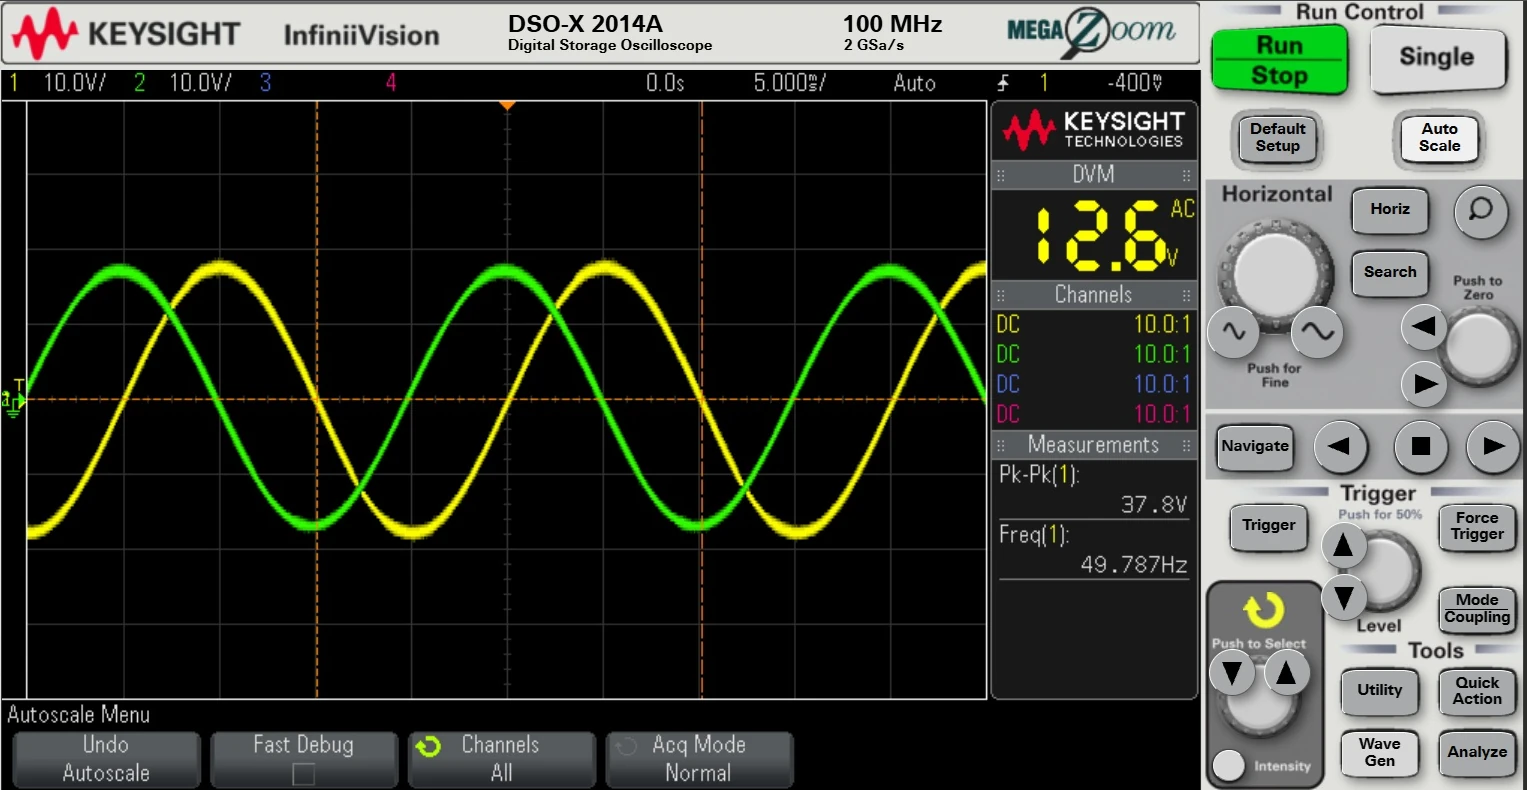
The two sine waves are regular and about 90° apart (a quarter of a period) in this capture, the phase being adjusted automatically and individually for each motor. At that moment, the optical sensor reports 33.33 rpm, the 1 kHz track of the test record reads 1.000 kHz, and the output frequency is about 49.8 Hz on the multimeter. The amplitude goes from 52.7 to 37.8 V peak-to-peak, about 72% of the 100% value for a 70% setting, which is within the oscilloscope's uncertainty.
With the motors, the tops of the sine waves are slightly thick. The measurements are made with the motors in place and turning: they generate a back-EMF that is superimposed on the output voltage and disturbs the signal.
Same measurement with 150 Ω resistors in place of the motors: the amplitude (52.7 V peak-to-peak) and the frequency (49.785 Hz) are unchanged, but the trace is clearly thinner. The disturbance therefore comes from the motors, neither from the output stage nor from the digital chain.
Output voltage distortion and noise
Isostase is not an audio amplifier: it drives synchronous motors at 50 to 120 Hz. THD+N is therefore used here as an indicator of the purity of the output voltage, not as a listening figure. Measurements with the QuantAsylum QA403 analyzer on the Isostase output, production configuration: first with 150 Ω resistors in place of the motors (at about 50 Hz, i.e. 33⅓ rpm, then about 67 Hz, i.e. 45 rpm), then with the motors in place at 33⅓ rpm. 64 k-point FFT, 48 kHz sampling, flat-top window, 10 averages.
| Load | Speed | Level | THD+N | Signal-to-noise ratio |
|---|---|---|---|---|
| 150 Ω | 33⅓ rpm | 25.08 dBV (18.0 V RMS) | −66.50 dB (0.047%) | 94.23 dB |
| 150 Ω | 45 rpm | 25.79 dBV (19.5 V RMS) | −66.97 dB (0.045%) | 93.37 dB |
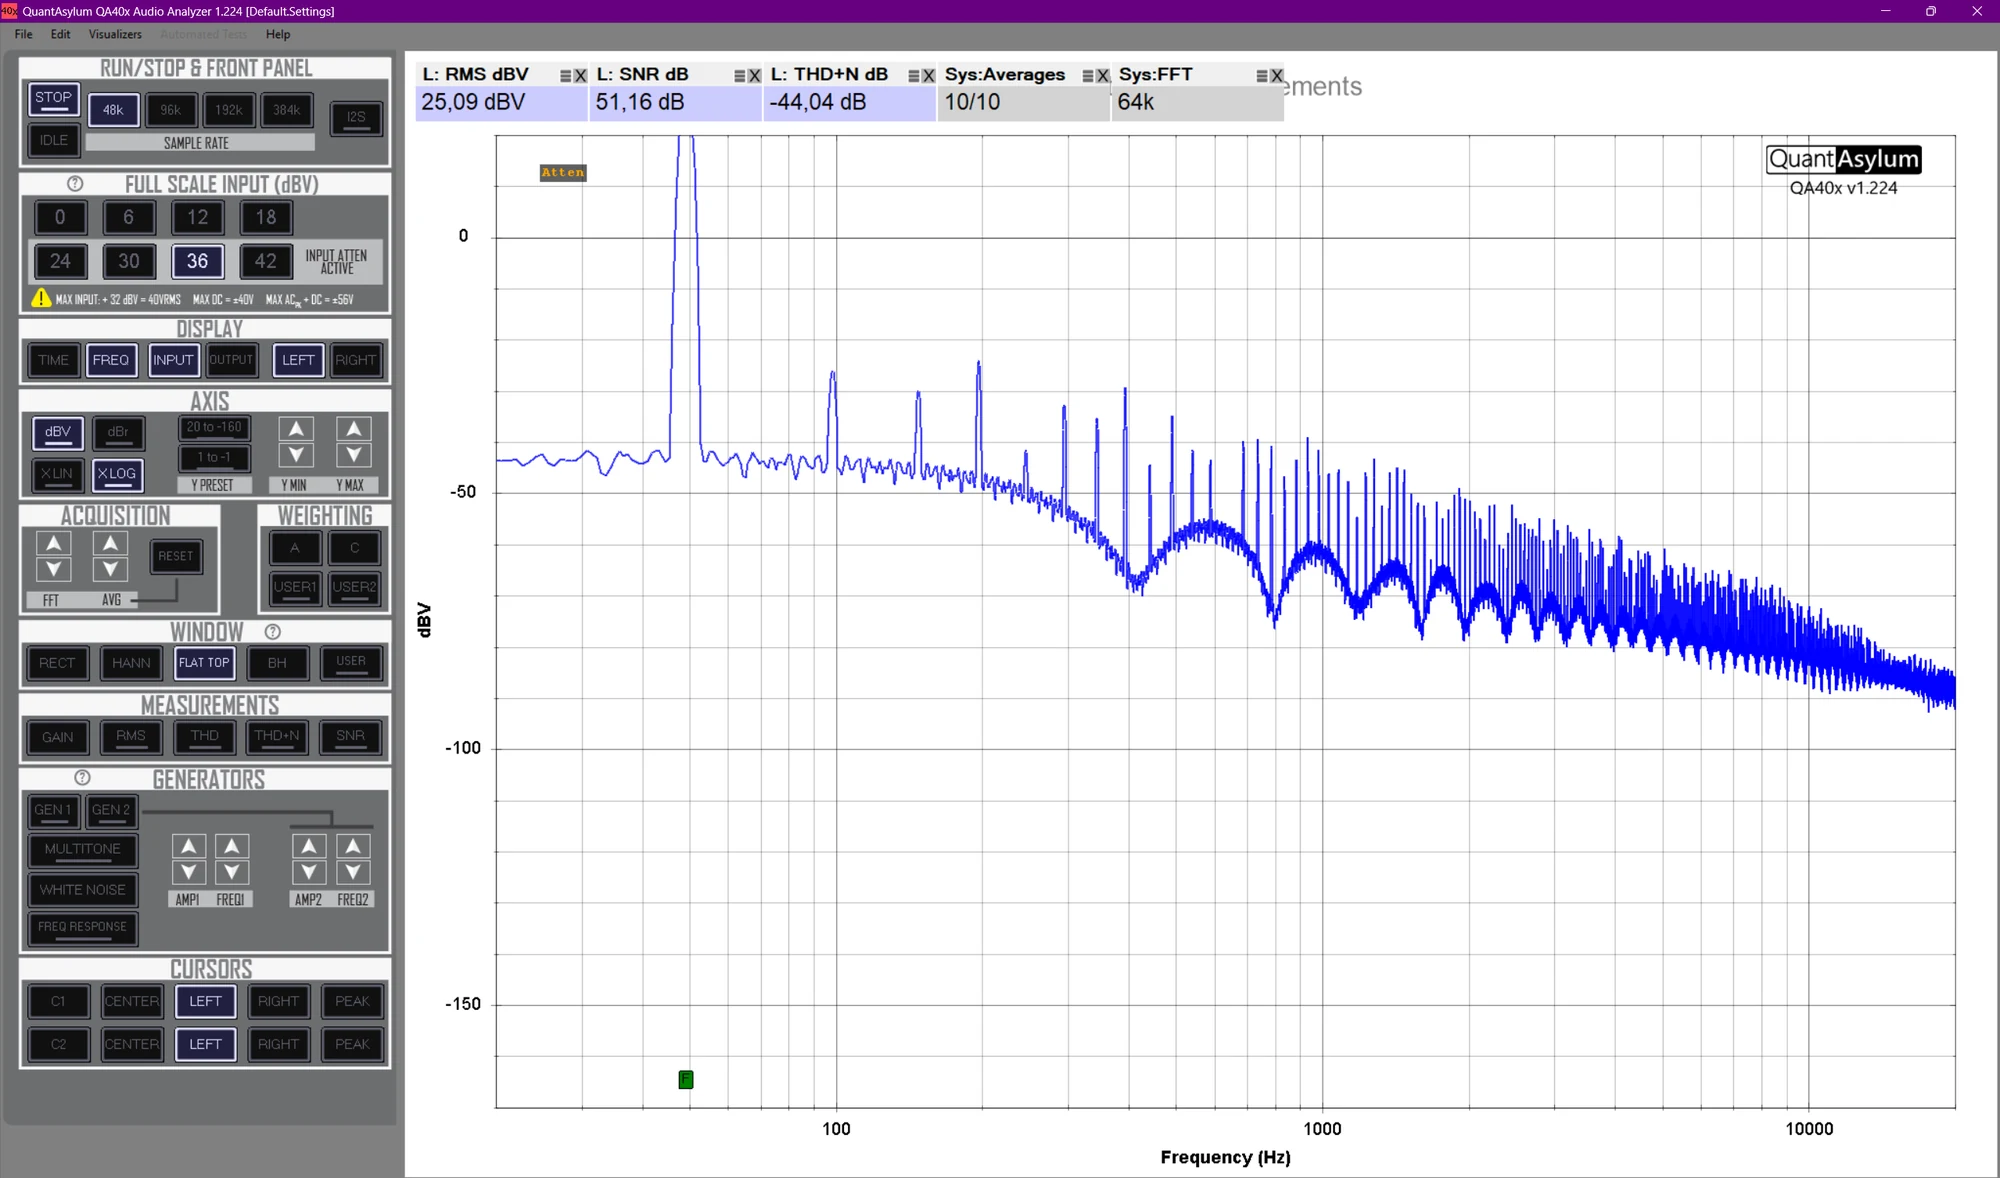
| Motors | 33⅓ rpm | 25.09 dBV (18.0 V RMS) | −44.04 dB (0.63%) | 51.16 dB |
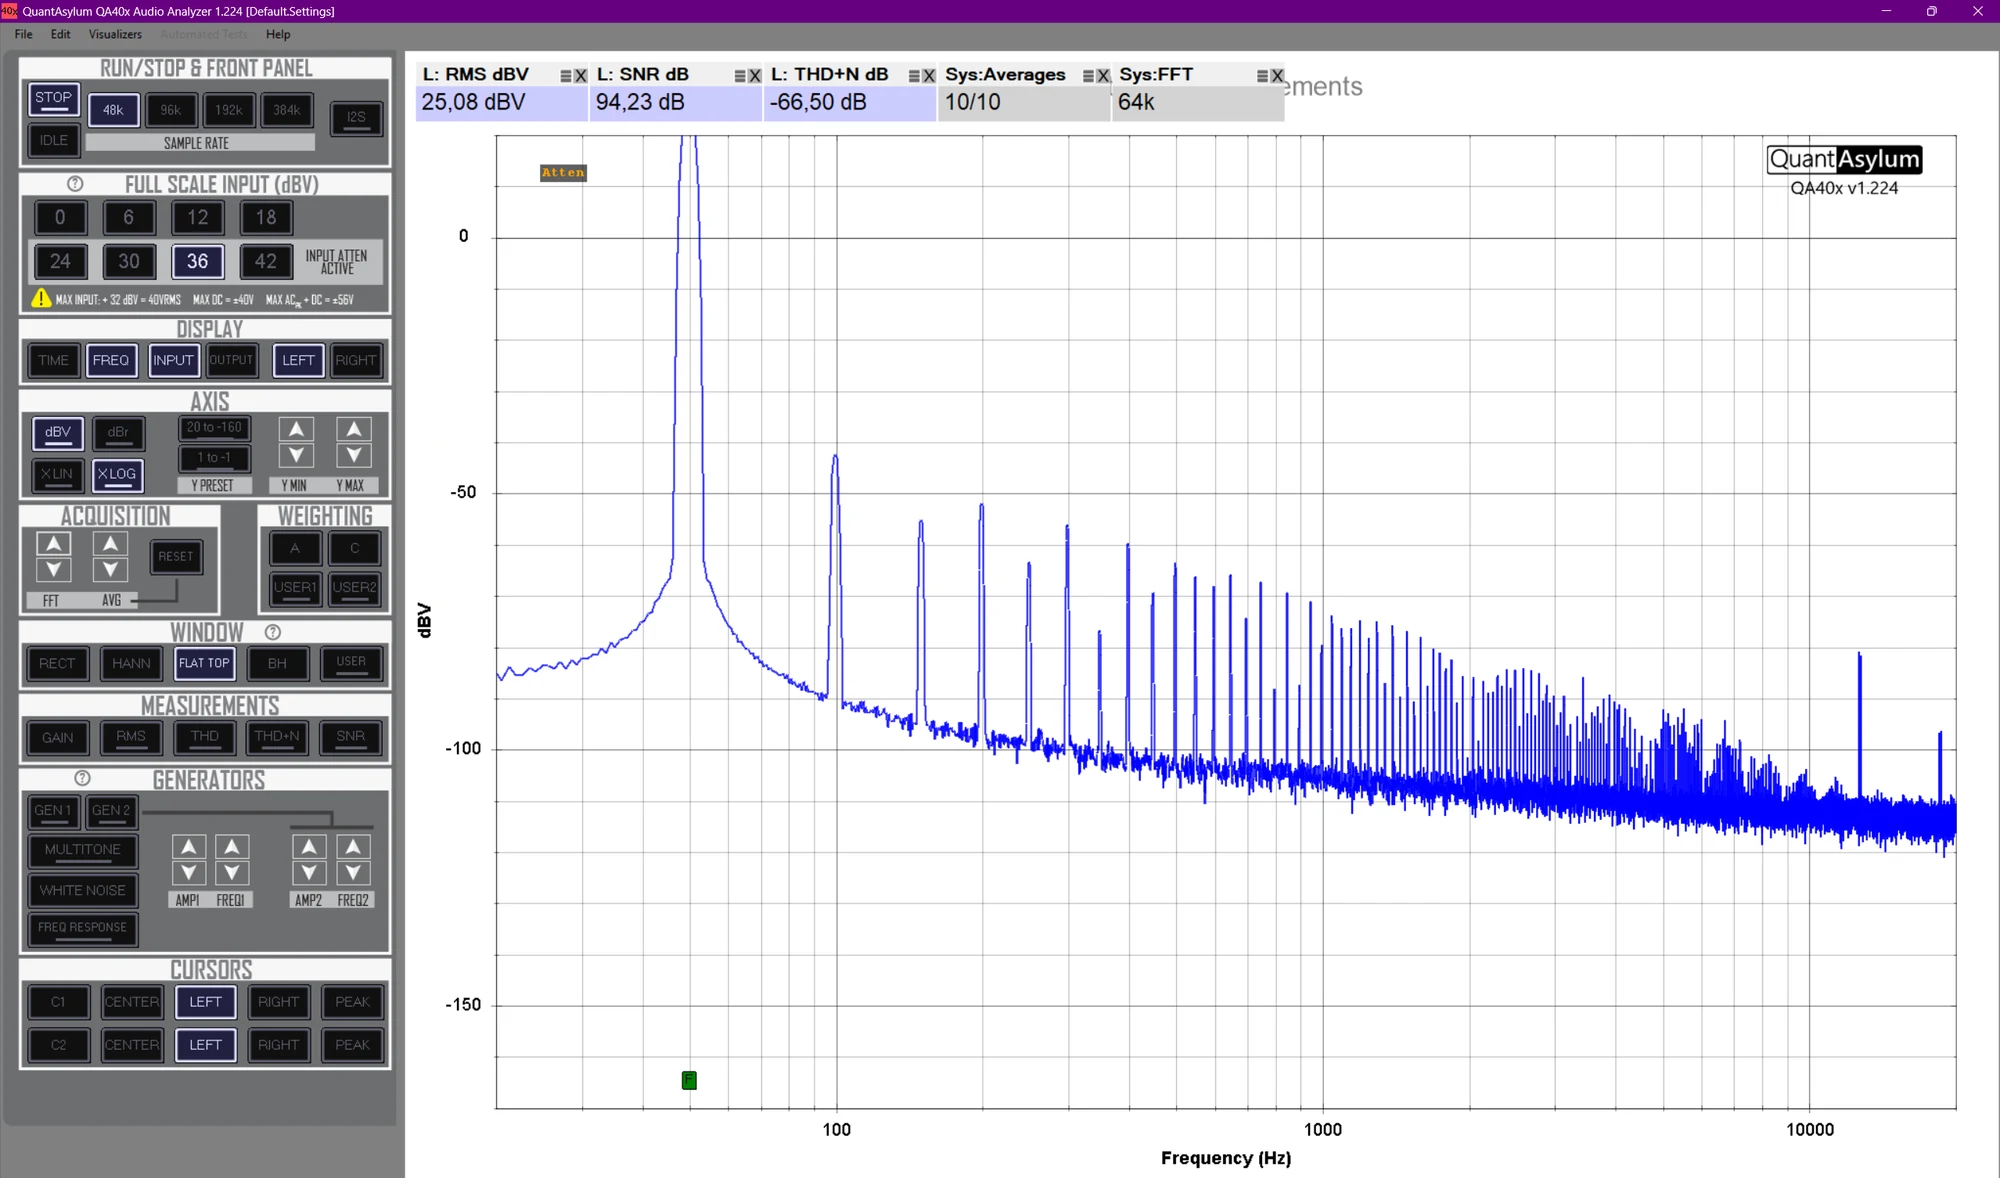
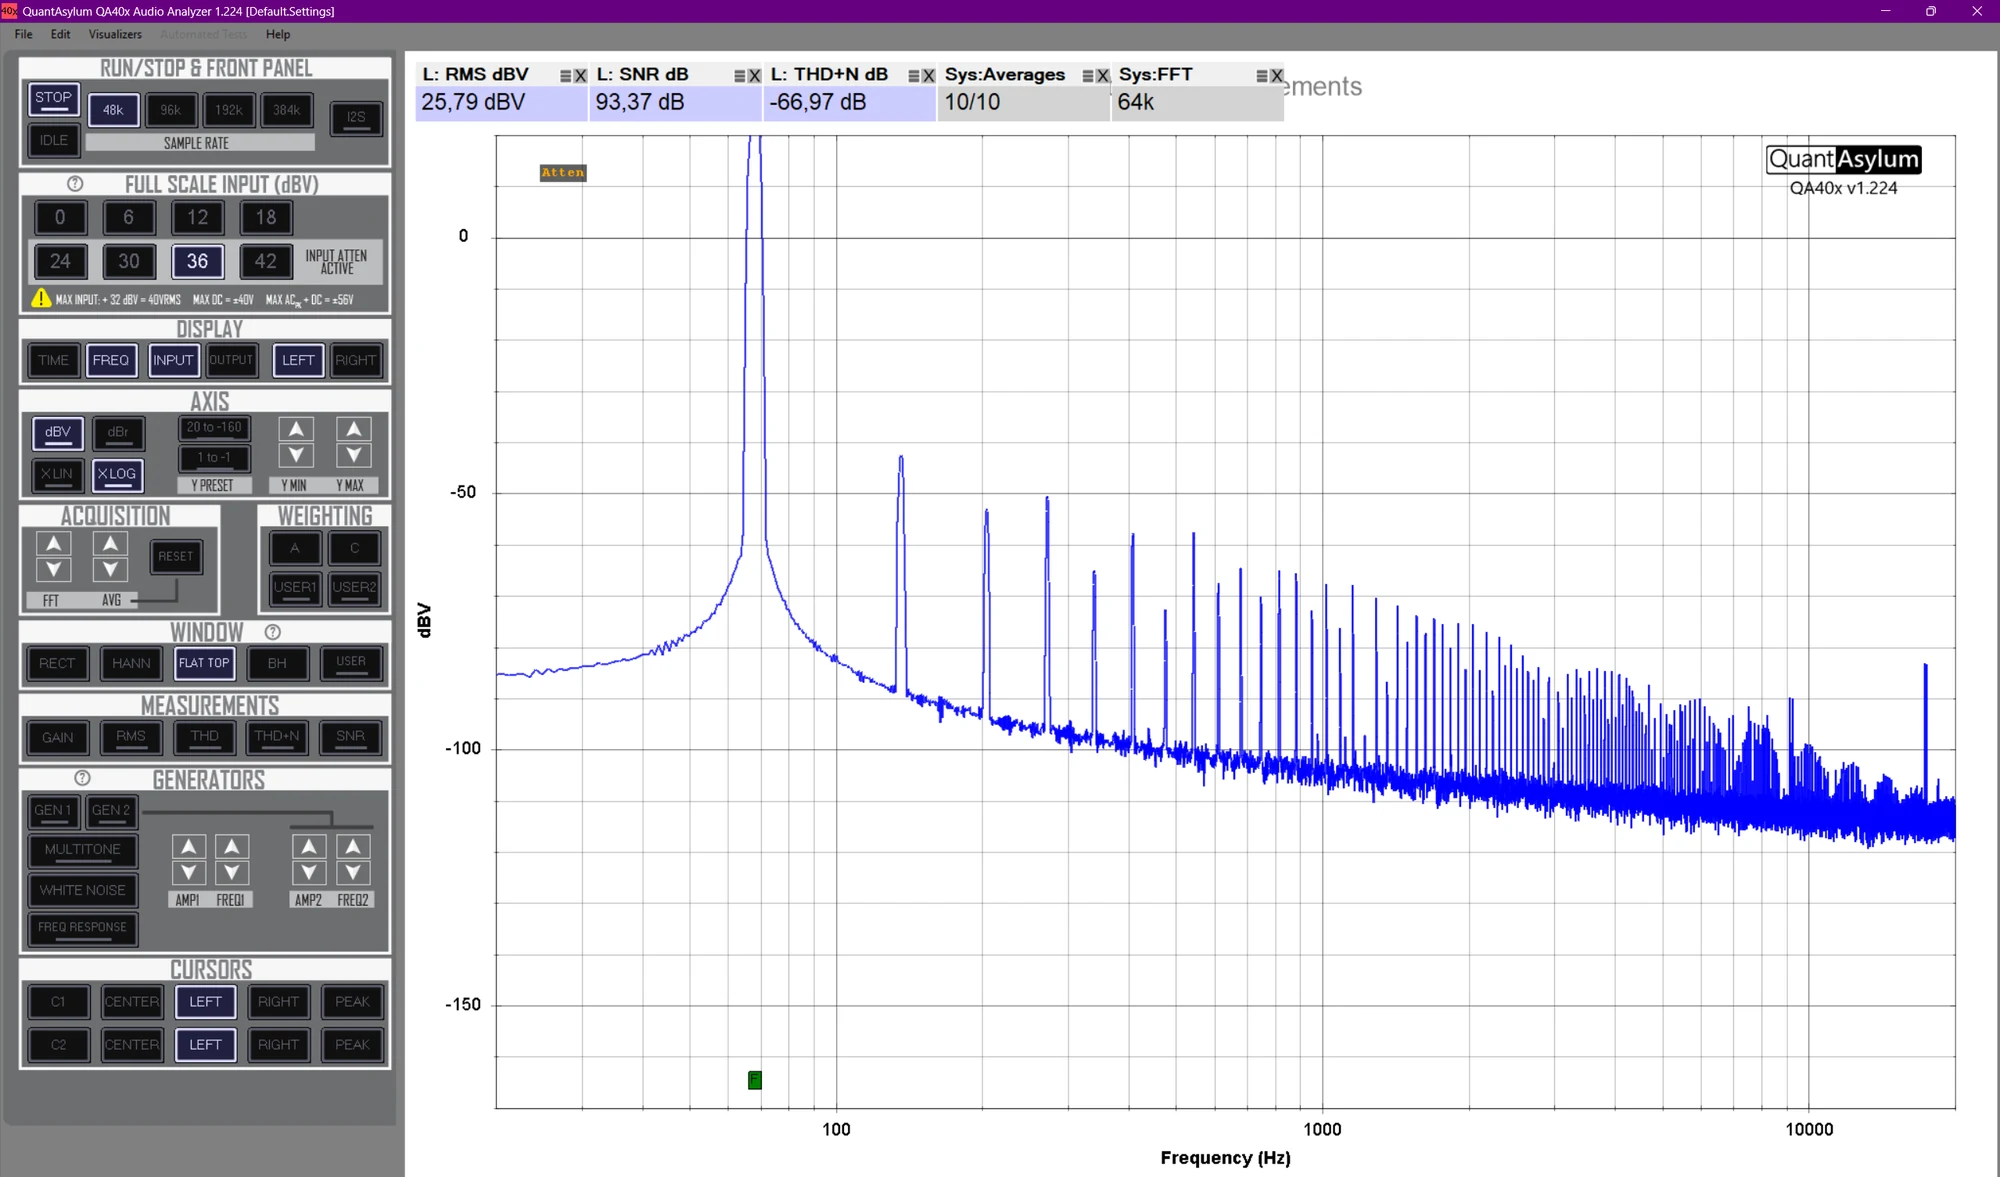
Into resistors, THD+N is 0.045 to 0.047%. The second harmonic dominates, about −68 dB below the fundamental; all the following ones are at −76 dB or lower, and noise, at −94 and −93 dB, is negligible compared with the distortion. The per-harmonic values are read off the plot, to about ±1 dB; their sum matches the displayed THD+N. The lines move with the output frequency (around 100, 150 and 200 Hz at 33⅓ rpm, around 135, 200 and 270 Hz at 45 rpm): they therefore do not come from the mains.
With the motors, THD+N rises to 0.63%, 13 to 14 times higher. The noise floor rises by 30 to 40 dB depending on frequency: the signal-to-noise ratio falls from 94 to 51 dB, and harmonics 2 to 8 come out between −49 and −67 dB below the fundamental (read off the plot; their sum is about −45 dB and, together with the noise, matches the displayed THD+N). This is consistent with the trace thickness seen on the oscilloscope: noise at −51 dB relative to an 18 V RMS signal is about 50 mV RMS. This excess comes from the motors, neither from the output stage nor from the digital chain: only the load changes, and it disappears when the motors are replaced by resistors.
Start-up and stop
Times measured with a 12 kg platter, from standstill. “Rise” is the time to reach nominal speed within ±0.5 %. Optical-sensor regulation is inactive during the rise: it engages at the end of the ramp and settles in 3 s. Without the sensor the turntable is therefore ready to play as soon as the rise ends; with the sensor, 3 s later.
| Speed (rpm) | Motors | Rise (±0.5 %) | Ready to play, without sensor | Ready to play, with sensor | Stop ramp | Total stop |
|---|---|---|---|---|---|---|
| 33⅓ | 1 motor | 7.0 s | 7.0 s | 10.0 s | 4.2 s | 5.0 s |
| 33⅓ | 2 motors | 5.0 s | 5.0 s | 8.0 s | 2.1 s | 2.9 s |
| 45 | 1 motor | 8.5 s | 8.5 s | 11.5 s | 6.0 s | 6.8 s |
| 45 | 2 motors | 5.8 s | 5.8 s | 8.8 s | 3.0 s | 3.8 s |
| 78 | 1 motor | 26.2 s | 26.2 s | 29.2 s | 11.1 s | 12.0 s |
| 78 | 2 motors | 14.6 s | 14.6 s | 17.6 s | 5.6 s | 6.4 s |
“Stop ramp” is the duration of the controlled deceleration. “Total stop” is the time until the platter is completely still.
The rise is slower at 78 rpm: small motors of this type lose torque as frequency increases, and the program limits acceleration to avoid any loss of synchronism. With two motors, more torque is available: the rise is faster and the stop ramp half as long.
Limits of these measurements
- A single channel (analyzer channel L); the fundamental runs off the top of the plot, the value given is the measured RMS voltage; the measurement with motors was made at 33⅓ rpm only.
- Absolute wow and flutter values reflect the whole chain (record, cartridge, arm, platter). Only the comparison between configurations is meaningful here, and no independent instrument was used to measure W&F.
- Speed is derived from the test tone, cross-checked against the platform's optical sensor and a 1 kHz track on the same record. These cross-checks are not fully independent, and no quartz stroboscope was used.
- The weighting strongly attenuates very slow components, such as record eccentricity.
- Run-to-run dispersion is not published.
- These figures say nothing about what the ear hears.
The takeaway
With Isostase, speed is held to about 0.03% of nominal, where the original supplies measured as found are off by 0.6 to 1.5%, with no measurable degradation of wow and flutter. More measurements will follow.
Related videos: Platter Speed